UCCE weather station network
Background
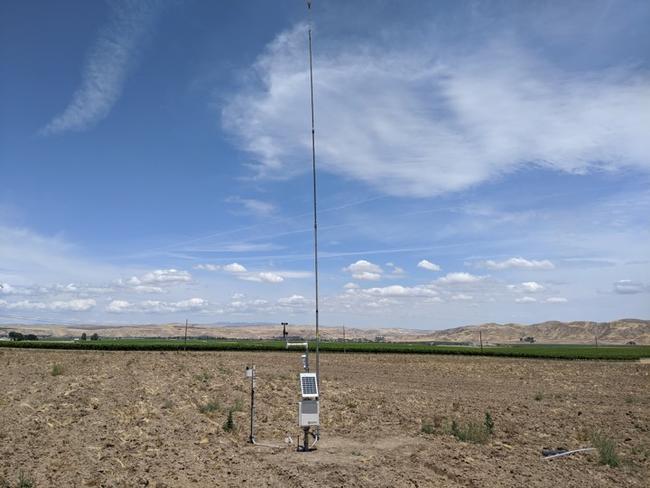
The weather stations of the UCCE network measure the standard variables of temperature, humidity, wind speed, rainfall and solar radiation. The stations also measure the temperature inversion conditions to help guide grower management decisions with respect to both frost protection and spray drift. The station data is available on the following website:
https://ucce-slo.westernweathergroup.com/
The stations measure the temperature inversion using a 30 foot tower. The reported "inversion" or "inversion strength" value is calculated by subtracting the air temperature at 5 feet from the air temperature at 30 feet. A positive "inversion" value indicates that a temperature inversion exists; the larger this value, the stronger the inversion condition is. A negative "inversion" value indicates that no inversion exists.
Benefits for frost protection
The temperature inversion measurement has a key application in predicting the potential benefit of using wind machines for frost protection. If temperature inversions commonly exist during our spring and/or fall frost events, this indicates that the operation of wind machines will provide a warming benefit to help protect crops. If cold events occur which do not have temperature inversion conditions, then under this type of event a wind machine may provide little or no benefit, and can sometimes lead to even more damage occurring. Therefore having real-time access to current inversion data is an important tool for growers who are relying upon wind machines for frost protection. For growers who are contemplating investing in wind machines, the historic data from this network will provide a clear picture of the relationship between frost events and associated inversion conditions.
Understanding spray drift risk
The same inversion measurement also has an important role relating to the drift risk of spray applications. Many pesticide labels include restrictions on applying the product if a temperature inversion exists, due to the increased risk for drift to occur under such conditions. However very few applicators are able to measure the inversion conditions in practice. The regional values of the temperature inversion provided by this network can help improve our understanding of the general patterns of inversion conditions throughout the day during the months when sprays are applied. Knowledge of these patterns can help with general planning of farming operations, for example to estimate how many hours per day on average are suitable for applying sprays which meet the label criteria for both inversion and wind speed conditions. The real-time data can also be consulted to help understand if current conditions in the region may pose any risks for spray drift.
Examples of drift risk parameters
Below are examples of the average inversion and wind speed conditions for June and July at two of the network weather stations (SLO-13 and SLO-14). The station SLO-13 is in the Templeton Gap, and SLO-14 is in the Edna Valley, representing an inland and coastal site respectively. As examples of the types of restrictions that may be included on a generic pesticide label, the red shaded areas indicate the time periods when the wind speed exceeds 5 mph or when a temperature inversion is present (the inversion value is greater than zero). Thus the red shaded areas represent time periods when conditions would not be ideal for spray applications and could potentially lead to violations of some pesticide labels. In the case of the SLO-13 station, the acceptable application window under these particular generic restrictions would be between 7:30 am and noon on average.
The two locations show very different patterns of inversion conditions during these two months. This is due to the coastal areas typically having fog or cloud cover at night during the summer; this insulating layer impedes the formation of inversions. Conversely the inland areas typically have very clear skies at night in the summer which enhances the formation of inversions at this time.
These types of summaries can be very helpful for understanding when the optimum spray application windows typically occur for a given set of label restrictions.
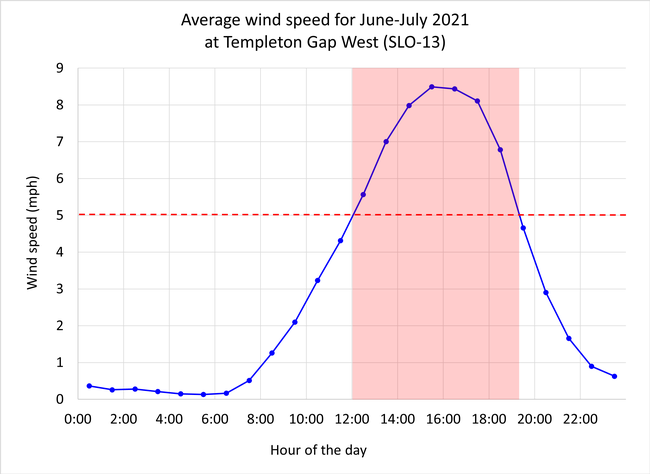
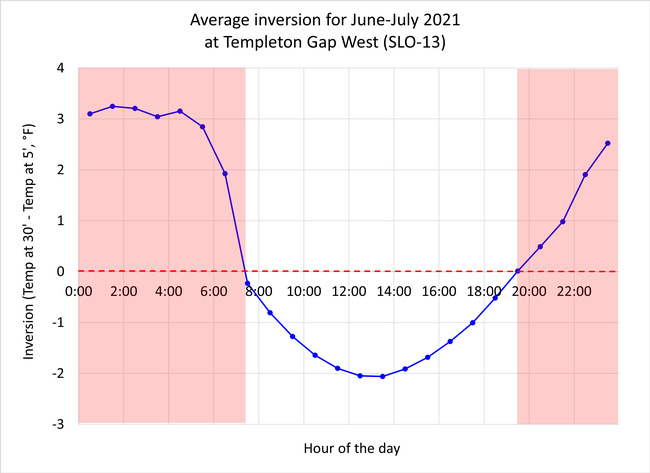
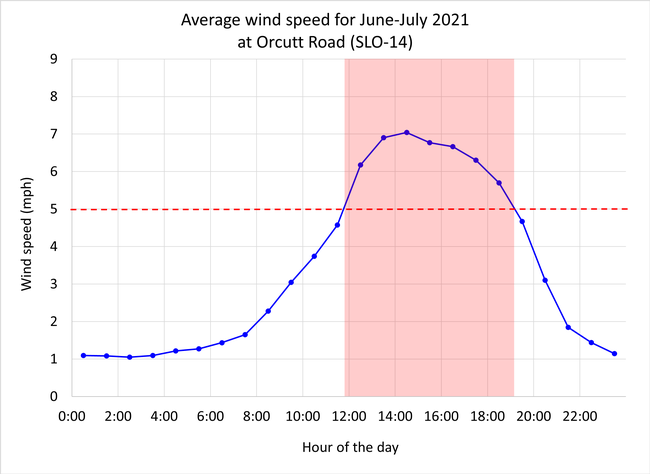
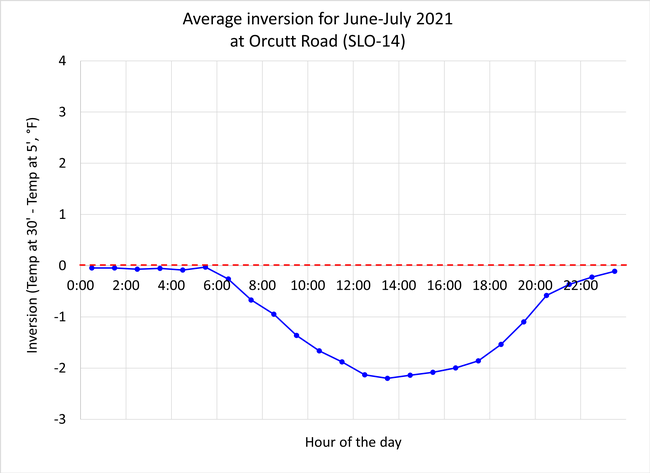
An important note: the above charts show the hourly values from the archived measurements available for download from the weather station website. However when plotting these values in the above charts, each hourly value was shifted 30 minutes earlier to make the chart more accurate visually. This is because the archived hourly data values are the average of the entire preceding hour of measurements; for example the archived value for 8:00 am is the average of all measurements that were made between 7:01 am and 8:00 am. Plotting this value at 7:30 am on a line chart makes for a more accurate visual representation than if it was plotted at 8:00 am.
